Are you sending emails but unsure what actually happens after hitting send? Many marketers focus only on volume. They usually ignore what happens in between delivery and user action. The average email open rate across industries is around 21%. However, it varies heavily depending on list quality and delivery success.
There are number of metrics behind every campaign in between from requested to delivered. These usually include open rate, conversion rate, email deliverability, complaints, email delivery and more. These metrics are not just numbers. They create a real-time system for email data analysis and performance tracking.
This guide explains how to read Aurora SendCloud email status reports like an expert. You will learn how to improve your email marketing strategy. It will also help you to increase your email deliverability rate, and use metrics like email open rate and email click-through rate to make smarter decisions.

Core Status Monitoring: The Four Gates of the Email Journey
Every email campaign passes through four key stages. Each stage provides insights that directly affect your email delivery optimization efforts.
The Starting Point: "Requested" and "Processing"
This stage is often overlooked. However, it forms the foundation of your entire email marketing performance. If there are issues here, everything that follows becomes unreliable.
- The Requested count reflects your campaign size. It tells you how many recipients you intended to reach. However, just because emails are requested does not mean they are successfully processed or delivered.
- The Processing stage shows system activity. If emails remain stuck in processing for too long, it may indicate system delays, API issues, or sending bottlenecks.
Tracking this stage helps answer critical questions:
- Are all emails entering the system correctly?
- Is there any delay in sending?
- Are there technical issues affecting campaign launch?
For example, if you request 50,000 emails but only 45,000 moves forward. It means you already have a gap before delivery even begins.
Why This Stage Matters?
Without accurate data at this level, your email data analysis becomes flawed. Every key metric like email open rate or email deliverability rate depends on the accuracy of your initial numbers.
Think of this stage as the input quality check. If your inputs are inconsistent, your results will be misleading.
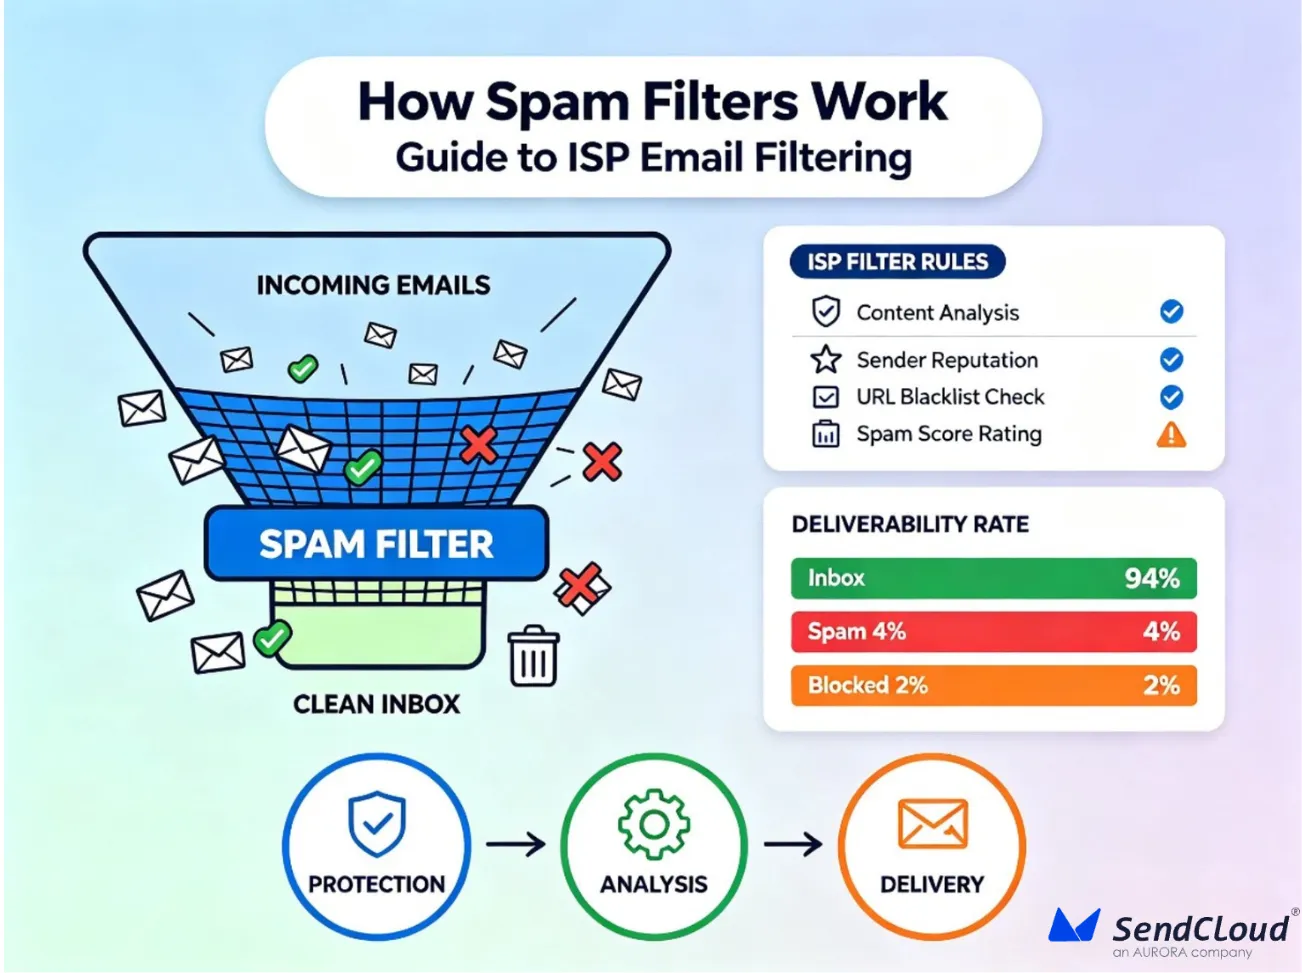
The Bar for Success: "Delivered" and Its Key Derivative Metrics
A strong email deliverability rate usually falls between 95% and 99%. If your rate drops below this range, it often signals deeper issues. These issues usually are poor list quality, sender reputation problems, or technical misconfigurations.
- Delivered Status: This means the email has successfully reached the mail server of recipient. It does not guarantee the email was opened. However, it confirms that delivery was technically successful.
- You can calculate your email delivery rate through this formula:
Rate = Delivered ÷ Requested
Engagement Metrics
Once emails are delivered, the next step is measuring how users interact with them. This is where engagement metrics come into play.
Email open rate
- Total Opens: Counts every time an email is opened, even by the same user
- Unique Opens: Counts only one open per user
Understanding this difference is important. A high number of total opens with low unique opens may mean a small group is repeatedly engaging. It means you are unable to connect the broader audience.
Email click-through rate
The same logic applies
- Total Clicks: Total number of clicks on links within the email.
- Unique Clicks: Number of individual users who clicked at least once
This helps you measure true engagement rather than repeated actions from a few users. Average click rates are often below 3%. It is showing how difficult it is to drive action even after delivery.
Why This Matters?
Looking at delivery alone is not enough. A campaign can have a strong email deliverability rate but still fail if engagement is low. By analyzing email open rate and email click-through rate, you can identify different issues. These issues include:
- Weak subject lines (low opens)
- Unclear messaging (low clicks)
- Poor targeting (low engagement overall)
This is where email marketing shifts from sending messages to understanding user behavior.
Temporary Roadblocks: "Soft Bounce"
A soft bounce occurs when an email cannot be delivered temporarily but may succeed in future attempts. It is not a permanent failure. However, it should not be ignored. Soft bounces usually happen due to temporary conditions such as:
- The mailbox of recipient is full
- Email server is temporarily down
- Message size exceeds limits
- Temporary filtering by the recipient server
Core Formula:
Soft Bounce Rate = Soft Bounce Count ÷ Requested Count
A growing soft bounce rate can signal deeper problems. If you left it unchecked, temporary failures will turn into permanent issues. These eventually will be harming your email deliverability rate. You can manage soft bounce issues effectively in ways like:
- Automatically retry sending after a delay
- Track bounce patterns across domains or providers
- Avoid sending too frequently to inactive users
- Reduce email size if attachments are too large
Permanent Failures & User Feedback
This stage reveals the most serious issues in your email marketing performance.
Invalid Emails
Invalid emails are addresses that cannot receive messages due to errors, non-existence, or permanent rejection. You can calculate invalid emails by:
Invalid Email Rate = Invalid Email Count ÷ Requested Count
A high number of invalid emails are one of the fastest ways to damage your sender reputation. It shows poor list management and reduces trust from email providers. This directly lowers your email deliverability rate. It may also cause future emails to land in spam folders.
Proactive User Feedback Metrics
- Spam Complaint
This happens when users manually mark your email as spam. You can calculate spam rate using the formula:
Spam Complaint Rate = Complaints ÷ Delivered
Even a small increase in spam complaint rate can have a serious impact. Spam rates above 0.1% can harm delivery performance.
-
Unsubscribe
This occurs when users opt out of your emails through a proper channel. You can
Unsubscribe Rate = Unsubscribes ÷ Delivered
While unsubscribes may seem negative, they are actually healthier than spam complaints. They allow users to leave without damaging your reputation.
The DeepDive Diagnosis Room
Understanding the key reasons of invalid emails is critical. Knowing these can help you in improving your email deliverability rate and maintaining list quality.
1. Blacklisted
This happens when your sending domain or IP is listed on a blacklist due to suspicious activity. This often happens after high complaint rates or spam-like behavior. Regular monitoring helps you to recover quickly.
2. Unsubscribed
These are the users who have already opted out of your service or news. However, you are still targeting them. If you keep sending emails to them, it violates best practices of email marketing. It also harms your email marketing credibility.
3. Server Unreachable
The server of recipient is temporarily unavailable. Retrying later usually resolves the issue. However, it is important to monitor repeated failures properly.
4. Invalid Address Format
Emails entered with incorrect syntax like missing “@” or domain comes under this category. Using validation tools at signup can help you to prevent these errors.
5. Address Does Not Exist
The email account has been deleted or never existed. Keeping such addresses in your list reduces your email deliverability rate.
6. Spam Filtering
Emails blocked due to suspicious content, formatting, or sender behavior comes under this category. Avoiding spam-like language and maintaining good practices can reduce this risk.
7. Recipient Rejected
The receiving server actively refuses the email. This may be due to poor sender reputation or strict filtering rules.
8. Other Errors
Unknown or rare technical issues that do not fall into standard categories. Tracking patterns over time helps identify recurring problems.
Building a Data-Driven Email Health Cycle
If you want to see real improvements in your email marketing strategies results, then you must work to turn insights into action. A strong email marketing guide approach always focuses on continuous improvement.
Here are the key steps that you should consider to build a data-driven email health cycle through these insights.
Monitor the Key Metrics Regularly
It is important to monitor core metrics of your email marketing strategy regularly. The key metrics to focus on are email deliverability rate, email open rate, email click-through rate, and spam complaint rate.
Regular monitoring allows you to identify trends, detect issues early, and adjust strategies before problems grow.
Implement Sending Optimizations
It is always important to optimize your email writings and timings. You should perform A/B testing for different elements like subject lines, call to action, content structure, etc.
Besides that, you should also consider sending emails based on the time zone of users. You can also analyze the past behaviors of your users to optimize the timing of your emails. This will ultimately help you to improve user engagement and increases the chances of higher email open rate and clicks.
Long-Term Reputation Maintenance
You should not forget the long-term maintenance of your reputation as an email sender. For this, you must:
- Follow permission-based email marketing practices
- Provide clear unsubscribe options
- Maintain consistent sending frequency
These habits protect your sender reputation and support long-term growth.
Conclusion: Let Data Be Your Email Marketing Navigator
Every email status has something to tell you about your email marketing strategy. These metrics creates a complete system for understanding performance. So, it is important to use these metrics as diagnostic tools to improve your email marketing strategies. The next time you should look more than how many emails you have sent. Look deeper at insights and see how you can make improvements to see results.