In Validity’s deliverability benchmarks, “1 in 6 marketing emails doesn’t reach the inbox,” even when it’s permission-based and “legitimate.” That’s the trap: email delivery can look healthy while real visibility quietly slips away.
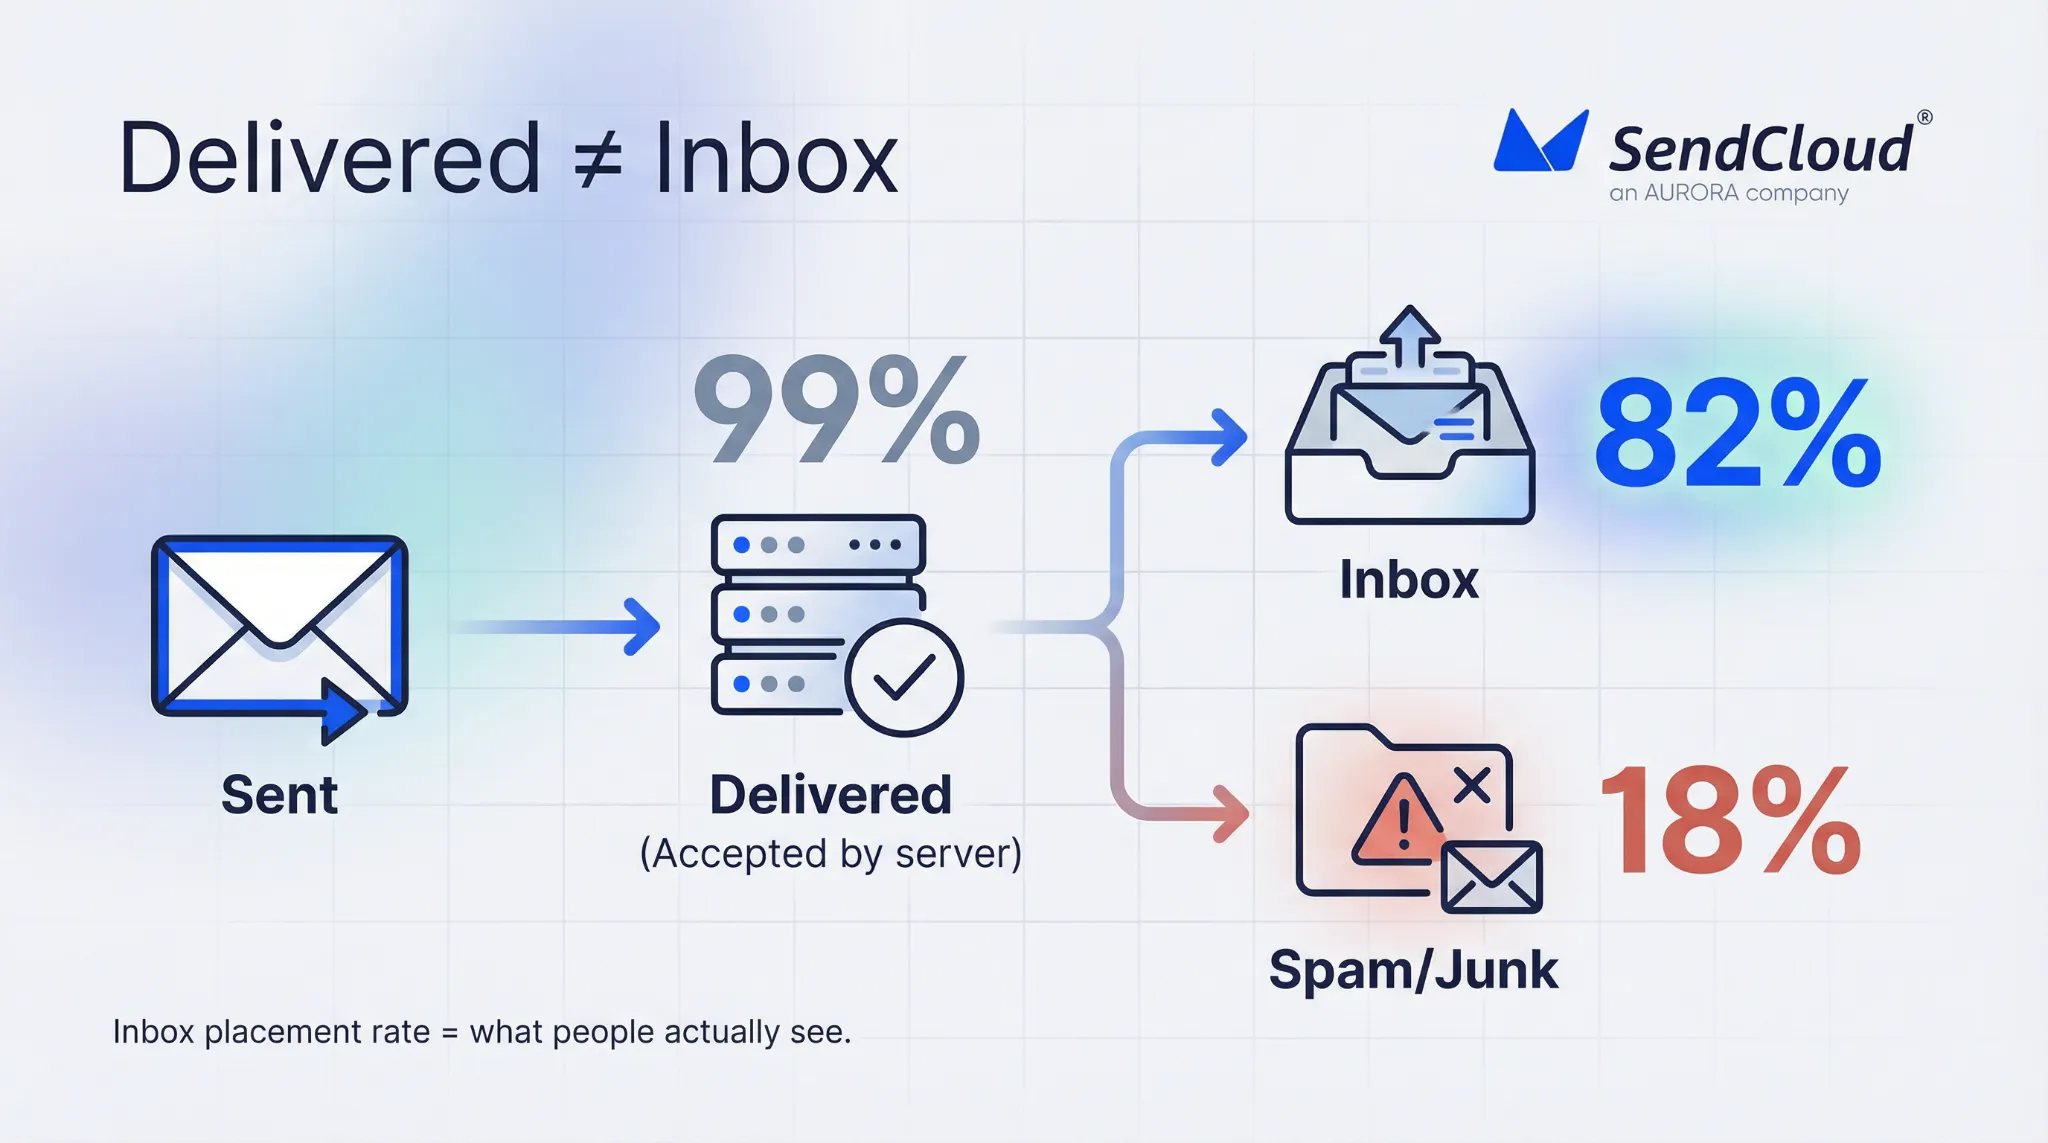
If you’ve ever seen 98–99% delivered and still felt like the campaign vanished, you’re not imagining it. “Delivered” often only means the receiving server accepted the message. It does not mean a person saw it in their inbox, trusted it, or opened it.
That’s why inbox placement rate is the KPI that tells the truth. If 100,000 emails are delivered but inbox placement drops from 95% to 80%, you didn’t lose “a little performance.” You lost 15,000 chances to be seen. And email that isn’t seen can’t convert.
Why Can “Email Delivery” Look Great While Performance Tanks
Email teams often mix up server success with customer visibility. Mailbox providers can accept your message, then sort it away based on risk, relevance, and user signals.
Delivered
Most platforms mark a message as delivered when the receiving server says “OK, I accepted it.” Mailjet explains this clearly: the delivery rate measures emails delivered to any folder, which includes spam.
So delivery is still useful. It tells you you’re not getting blocked outright or hard-bouncing at scale. But it can’t tell you if you’re winning attention.
Placed
Placement is where you actually feel deliverability: inbox vs spam (and sometimes other filtering buckets).
Validity’s benchmark data shows just how big the gap can be at provider level. For Microsoft, they report 75.6% inbox placement and 14.6% spam placement. That can happen while your dashboard still looks “fine” on delivery.
When placement shifts, performance drops fast because fewer people ever get a chance to open or click.
Visibility
Even when you land in “the inbox,” visibility is not guaranteed. Tabs, bundling, and user fatigue can hide you. But the most brutal visibility killer is still spam classification—because spam is where email goes to be ignored.
Google’s sender guidance ties this to one clean signal: user-reported spam rate. They recommend keeping it below 0.1%, and warn you should prevent it from ever reaching 0.3% or higher because it has a stronger negative impact on inbox delivery.
What Is Inbox Placement Rate (And Why Is It The Real Email Marketing Kpi)
A surprising number of senders think “delivery rate = inbox rate.” Mailjet found 50.9% of senders believe delivery rate is “the percentage of emails that reach the inbox,” which is not how it works.
Inbox placement rate fixes that misunderstanding by focusing on the only outcome that matters: was your email actually placed where a person can see it?
This matters because email can be a massive revenue channel when it’s visible. In Litmus’ State of Email data, 35% of companies report getting $10–$36 back for every $1 spent on email marketing. That ROI depends on reaching the inbox, not just a server handshake.
Inbox placement rate is the percentage of delivered emails that land in the inbox instead of the spam/junk folder.
Formula
A common formula is: (Emails in the inbox ÷ Emails delivered) × 100.
If your ESP can only show “delivered,” you’re missing the most important split: inbox vs spam.
Deliverability (quick clarity)
People use “deliverability” loosely. A simple way to keep teams aligned:
- Delivery = the message was accepted by the receiving server
- Deliverability = your ability to reach the inbox reliably
- Inbox placement rate = the KPI that proves deliverability is working
Tabs
Some inboxes aren’t one box anymore. Gmail has tabs (like Primary and Promotions), and other clients sort mail in different ways. Tabs can reduce visibility, but spam placement is the real failure. Most teams should first protect “inbox vs spam,” then improve where they land inside the inbox.
How Do You Measure Inbox Placement Rate In The Real World
You usually can’t measure inbox placement perfectly from one dashboard. In practice, strong teams triangulate: direct testing, mailbox-provider signals, and performance patterns.
Seed tests
Seed tests send your email to controlled test inboxes across providers, then report where messages landed. This is how you get a true “inbox vs spam” view by provider.
If you want a benchmark for what “serious” seed testing looks like, Validity says its Everest testing uses thousands of seed accounts across 140 ISPs globally.
Panel / network data
Some deliverability platforms also use large-scale network data to show trends and benchmarks (helpful for “is this just us, or is this provider getting stricter this week?”). It’s not perfect, but it can add context around sudden shifts.
Postmaster tools
Mailbox-provider tools won’t always give you a clean inbox placement percentage. But they give you the inputs that drive inboxing.
Google’s sender guidance is especially practical here because it ties outcomes to spam-rate thresholds and enforcement consequences (and it’s updated for the post-2024 rules).
Proxies
When direct placement data is limited, you watch “proxy signals” in your own data. The most useful ones are usually complaints, bounces, and clicks. If clicks drop sharply while delivery stays steady, placement is often the first suspect.
How Do Isps Decide Inbox Vs Spam
Mailbox providers optimize for safety and user experience. They are fighting spam at massive scale.
In Google’s own words, Gmail’s AI defenses stop more than 99.9% of spam, phishing, and malware and block nearly 15 billion unwanted emails every day. That’s the filtering environment your marketing email has to pass through.
Here are the main decision buckets that usually matter most.
Authentication
Authentication is your identity proof. It answers: “Is this sender allowed to use this domain?”
The rules got stricter in 2024 and 2025, and those dates matter:
- Yahoo requires bulk senders to use SPF + DKIM, publish DMARC (at least p=none), support one-click unsubscribe, and keep spam rates low (they cite <0.3%), with unsubscribes honored within 2 days.
- Microsoft announced it would begin rejecting messages for high-volume senders that don’t meet authentication requirements, starting May 5, 2025, with the error: “550; 5.7.515 … does not meet the required authentication level.”
If authentication and alignment are shaky, inbox placement becomes unstable no matter how good your content is.
Reputation
Reputation is your track record. Providers watch complaints, bounces, engagement, and sending consistency over time. A sender can be fully authenticated and still get filtered if user signals are bad.
Content
Content is not just “spammy words.” Providers also assess link quality, domain consistency, formatting, and patterns associated with abuse. Content usually becomes a bigger problem when trust is already weak.
Engagement
Mailbox providers learn from what users do. If people ignore you, delete you, or mark you as spam, your future mail is more likely to be filtered away.
Patterns
Spiky volume, long silences followed by blasts, sudden list growth, and constant identity changes (from name/domain churn) are all common patterns. Predictable sending is easier to trust.
How To Improve Inbox Placement Rate (A Framework You Can Run Every Week)
Validity’s benchmark pegs the global inbox placement rate at 83.5% in 2024. That’s a reminder that “pretty good” still leaves meaningful money on the table.
Here’s a weekly framework that keeps the core levers tight, without chasing hacks:
- SPF: Keep one SPF record, and make sure every real sender is included. Broken SPF creates “silent doubt” even when delivery looks fine.
- DKIM: DKIM-sign every stream (marketing + transactional). Use stable selectors and don’t let intermediaries break the signature.
- DMARC: Start with reporting, then enforce once alignment is clean. DMARC only helps when SPF or DKIM aligns with your From domain.
- Warm-up: For new domains/IPs, ramp slowly and start with engaged recipients. Sudden spikes are a common reason for spam placement.
- IP strategy: Match your IP approach to your volume and consistency. Separate transactional and marketing where possible to protect critical mail.
- Cadence: Keep a steady sending rhythm. Predictability builds trust with providers and with users.
- List hygiene: Remove hard bounces fast and stop mailing long-term inactive addresses. Low-quality lists create the exact signals providers punish.
- Segmentation: Mail engaged users more often and cold users less often. This keeps your engagement signals strong.
- Content checks: Keep HTML clean, include plain-text, and keep link domains consistent with your brand.
- A/B testing: Test one variable at a time, and don’t run risky tests on cold segments first.
- Complaints: Keep user-reported spam rates low. Google recommends staying below 0.1% and preventing rates from reaching 0.3% or higher.
- Monitoring: Track provider signals weekly, not just campaign-by-campaign, so you catch drift early.
Which Tools Help You Avoid The Spam Folder (Selection Guide)
Most teams don’t need 12 tools. They need a simple stack that answers three questions: Where did it land? Why? What changed?
Seed testing tools (like GlockApps) are the fastest path to a real inbox placement readout. Mail-Tester is useful as a quick pre-flight check for common content and configuration issues. (These are helpful complements, not substitutes for good sending practices.)
For mailbox-provider truth, Google Postmaster Tools and Microsoft SNDS-style signals are hard to replace. Google’s published guidance also gives you clear spam-rate thresholds that tie directly to inbox impact.
How Aurora Sendcloud Helps Improve Inbox Placement Rate
Aurora SendCloud is strongest when you use it to make the “boring basics” consistent: authentication, controlled sending, and clear monitoring.
It supports domain setup with required DNS records (SPF, DKIM, MX) and recommends DMARC for stronger protection.
It also provides a sending queue dashboard so you can see delivery flow by receiving domain and spot pauses or throttling faster.
On the marketing side, Aurora SendCloud includes warm-up, A/B testing (subject, content, From, send time), reporting, segmentation/audiences, and AI content optimization.
And for measurement, it supports tracking for opens, clicks, and unsubscribes, with clear configuration in the product settings.
Conclusion
If you want email that performs, stop treating “delivered” as success. Delivery only confirms the receiving server accepted the message. Inbox placement rate tells you whether your email was actually placed where a person can see it and act on it.
The path to higher inbox placement is not tricks. It’s a repeatable system: clean authentication, steady sending patterns, strong list quality, and real engagement. When you run that system weekly, placement becomes predictable—and your results stop swinging in ways your dashboard can’t explain.
You can manage this more easily with Aurora SendCloud.